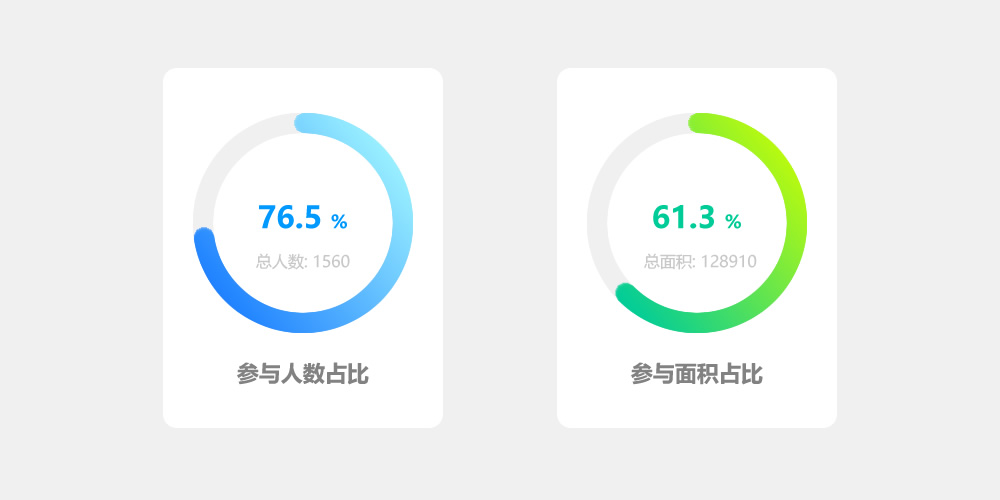
最近在小程序项目开发中,遇到了一些图表数据展示的需求,需要使用环形图来展示一些数据的占比情况,效果如上图所示。
在小程序中想要实现圆环效果,需要通过canvas来实现绘画圆形,观察上图效果,我们来考虑下实现思路,图片中效果,可以通过底部的灰色圆环加上彩色的进度圆环叠加实现。需要注意的是,网上很多教程还在使用“wx.createCanvasContext”,来绘制图形,而目前“wx.createCanvasContext”已被停用,最新的应使用type=2d,wx.createSelectorQuery()来绘制环形图。
话不多说,下面就让我们来看下canvas实现环形图的具体步骤:
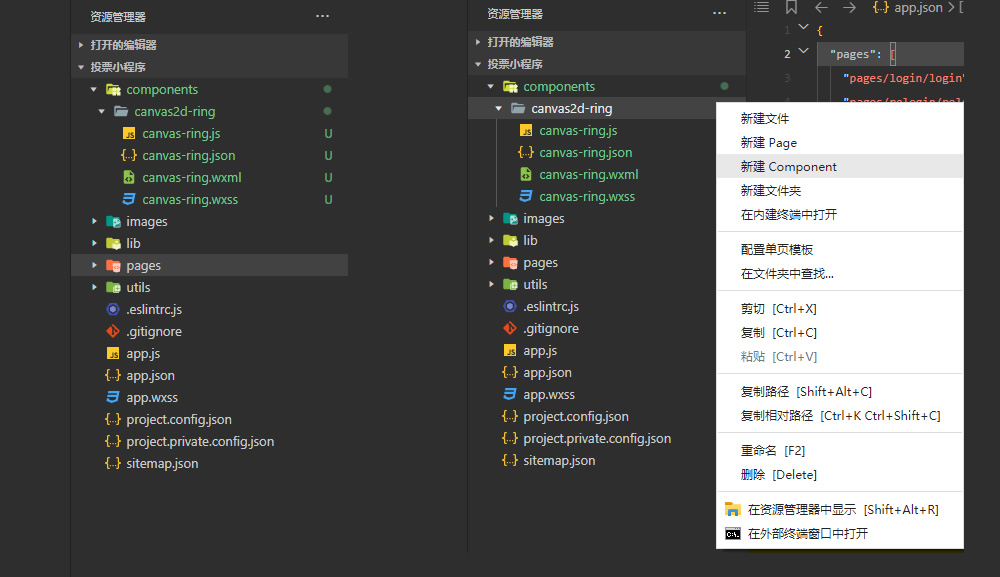
- 首先我们在小程序工程文件更目录创建一个components文件夹,用来存放需要引用的自定义组件。
- 在components文件夹下,新建一个名为“canvas2d-ring”的文件夹,用于存放环形图组件。
- 鼠标点开canvas2d-ring,鼠标右键,选择“新建Component”,取名“canvas-ring”,此时系统会自动生成名为“canvas-ring”的json,js,wxml,wxss四个文件。
我们来看看环形图组件的具体代码,canvas-ring.json:
{ "component": true,//这里一定要写成'true' "usingComponents": {}//这里可引入其他组件}在canvas-ring.wxml中,编写环形图组件页面结构
<canvas style="width:{{canvasWidth}}px;height:{{canvasWidth}}px; margin:0 auto;position:relative" type="2d" id="myCanvas" > <view class="circle-bar" style="height:{{canvasWidth}}px;"> <view class="title_name"> {{title}} </view> <view class="title_val" style="color: {{valueColor}}; font-weight:{{f_weight}}; margin-top:{{show_tip?'10':'0'}}rpx;font-size:{{f_size}}px"> {{value}} {{suffix}} </view> </view></canvas>在canvas-ring.wxss中,编写环形图组件样式
.circle-bar{ width: 100%; display: flex; flex-direction: column; justify-content: center; align-items: center; text-align: center; position: absolute; top: 0;}.circle-bar .title_name{ max-height: 62rpx; font-size: 26rpx; overflow:hidden; text-overflow:ellipsis; display:-webkit-box; -webkit-box-orient:vertical; -webkit-line-clamp:2;}.circle-bar .title_val{ color: #333333;}下面是环形图组件,最核心的js部分,canvas-ring.js页面:
var windWidth = wx.getSystemInfoSync().windowWidth;//这里获取下设备的屏幕宽度
Component({
/**
* 组件的属性列表
*/
properties: {
//画布的宽度 默认占屏幕宽度的0.4倍
canvasWidth: {
type: Number,
value: windWidth * 0.4
},
//线条宽度 默认10
lineWidth: {
type: Number,
value: 10
},
//线条颜色
lineColor: {
type: String,
value: “#3696FA”
},
//标题 默认“完成率”
title: {
type: String,
value: “完成率”
},
//当前的值 默认45
value: {
type: Number,
value: 45
},
//值的颜色 默认””
valueColor:{
type: String,
value: “#333”
},
//值的字体的大小颜色 默认28rpx
f_size: {
type: Number,
value: 14
},
f_weight:{
type: String,
value: “500”
},
//最大值 默认100
maxValue: {
type: Number,
value: 100
},
//最小值 默认0
minValue: {
type: Number,
value: 0
},
//当前值的后缀名
suffix: {
type: null,
value: “%”
},
//从什么角度开始 0~360之间 (12点方向为0,18点方向为180,0点方向为360)
startDegree: {
type: Number,
value: 0
}
},
/**
* 组件的初始数据
*/
data: {
canvasWidth:’ windWidth * 0.4′,//默认创建的环形图宽度为屏幕宽度的40%
show_tip: true
},
/**
* 组件的方法列表
*/
methods: {
drawCanvasRing() {
//没标题的时候去掉margin-top的值
if (this.data.title.replace(/(^\s*)|(\s*$)/g, “”).length == 0) {
this.setData({
show_tip: false
})
}
//canvas 2d
const query = wx.createSelectorQuery().in(this);
query.select(‘#myCanvas’)
.fields({ node: true , size: true})
.exec(this.init.bind(this))
},
init(res){
const canvas = res[0].node
const ctx = canvas.getContext(‘2d’);
canvas.requestAnimationFrame(()=>{
console.log(‘1111111111111111111111’)
})
const dpr = wx.getSystemInfoSync().pixelRatio
canvas.width = res[0].width * dpr
canvas.height = res[0].height * dpr
ctx.scale(dpr, dpr);
// 大小值的计算
var circle_r = this.data.canvasWidth / 2; //画布的一半,用来找中心点和半径
var startDegree = this.data.startDegree; //从什么角度开始
var maxValue = this.data.maxValue; //最大值
var minValue = this.data.minValue; //最小值
var value = this.data.value; //当前的值
var lineColor = this.data.lineColor; //线条颜色
var lineWidth = this.data.lineWidth; //线条宽度
var percent = 360 * ((value – minValue) / (maxValue – minValue)); //计算结果
//定义起始点
ctx.translate(circle_r, circle_r);
//灰色圆弧
ctx.beginPath();
ctx.strokeStyle=”#ebebeb”;
ctx.lineWidth=lineWidth;
ctx.arc(0, 0, circle_r – 10, 0, 2 * Math.PI, true);
ctx.stroke();
ctx.closePath();
//有色彩的圆弧
ctx.beginPath();
ctx.strokeStyle=lineColor;
ctx.lineWidth=lineWidth;
ctx.arc(0, 0, circle_r – 10, startDegree * Math.PI / 180 – 0.5 * Math.PI, percent * Math.PI / 180 + startDegree * Math.PI / 180 – 0.5 * Math.PI, false);
ctx.stroke();
ctx.closePath();
}
}
})
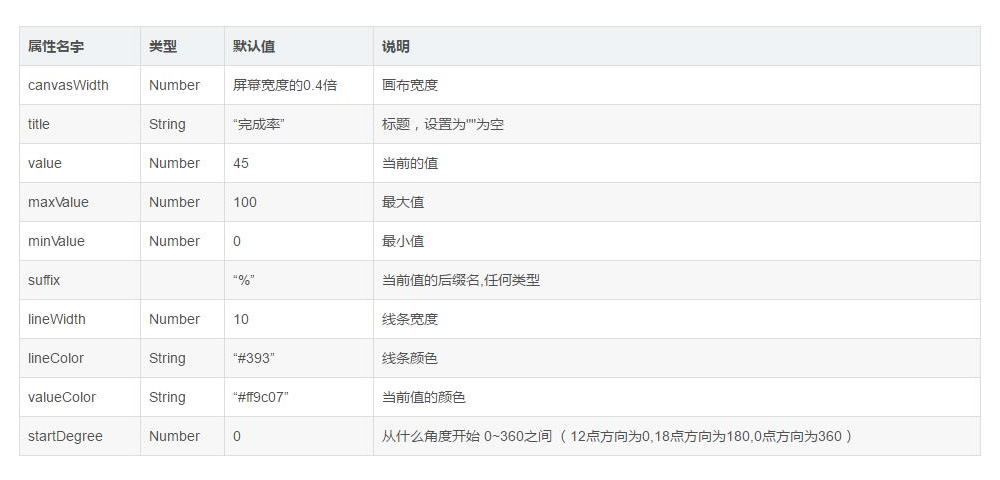
到此,我们就创建好了一个环形图组件,组件的相关参数设置,如下图所示: